As user bases grow and traffic surges, the need for scalable solutions becomes more pressing. Elixir, a functional programming language built on the Erlang Virtual Machine (BEAM), has gained recognition for its fault-tolerance, concurrency, and distributed systems capabilities.
In the ever-evolving landscape of modern web applications, scalability is a paramount concern. As user bases grow and traffic surges, the need for scalable solutions becomes more pressing. Elixir, a functional programming language built on the Erlang Virtual Machine (BEAM), has gained recognition for its fault-tolerance, concurrency, and distributed systems capabilities. In this technical blog, we embark on a journey through the intricacies of scaling Elixir applications, exploring the foundations of distributed systems and the power of clustering.
Understanding the Basics of Elixir and BEAM
Before delving into scaling strategies, let’s revisit the fundamentals of Elixir and the BEAM VM. Elixir, known for its concise syntax and functional paradigm, is designed to build scalable and maintainable applications. The BEAM VM, the runtime for Elixir, brings unique features such as lightweight processes, preemptive scheduling, and fault-tolerance.
Lightweight Processes and Concurrency
Elixir’s concurrency model relies on lightweight processes, not to be confused with operating system processes. These lightweight processes are incredibly efficient, allowing for the creation of thousands of concurrent processes without significant overhead. This concurrent model facilitates parallel execution, enhancing the overall performance of Elixir applications.
Fault-Tolerance with OTP
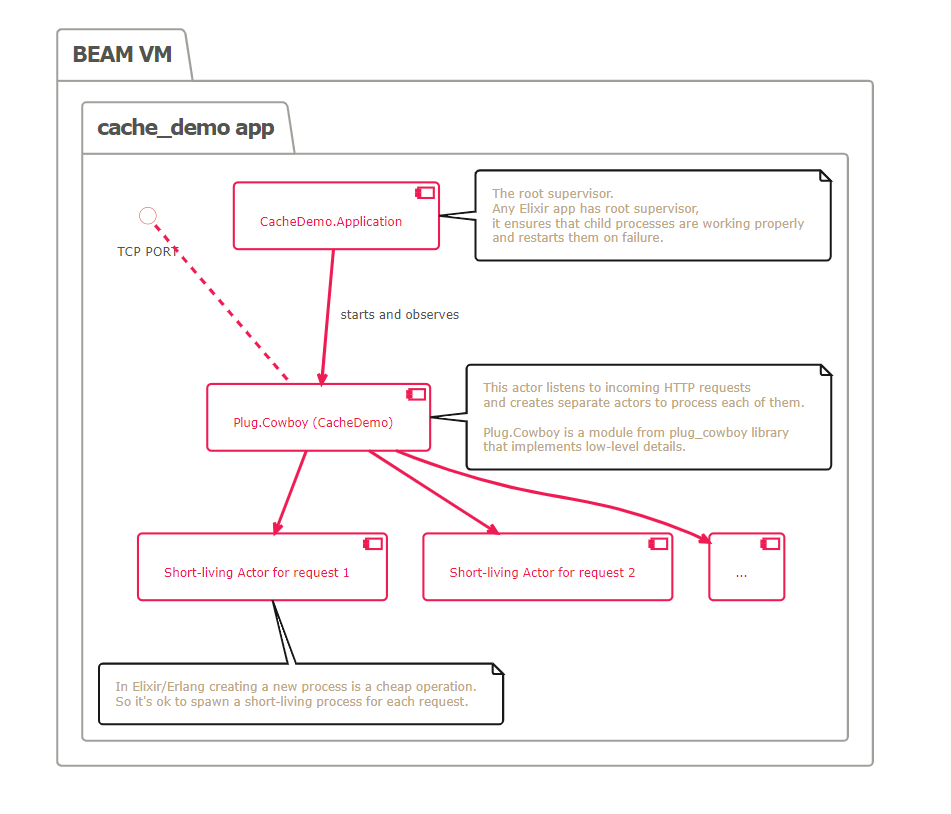
The Open Telecom Platform (OTP) is a set of libraries and tools that complement Elixir’s functionality. OTP brings a robust framework for building fault-tolerant systems through concepts like supervisors, which monitor and restart failed processes. Understanding how OTP works is crucial for building scalable and resilient Elixir applications.
Exploring Distribution in Elixir
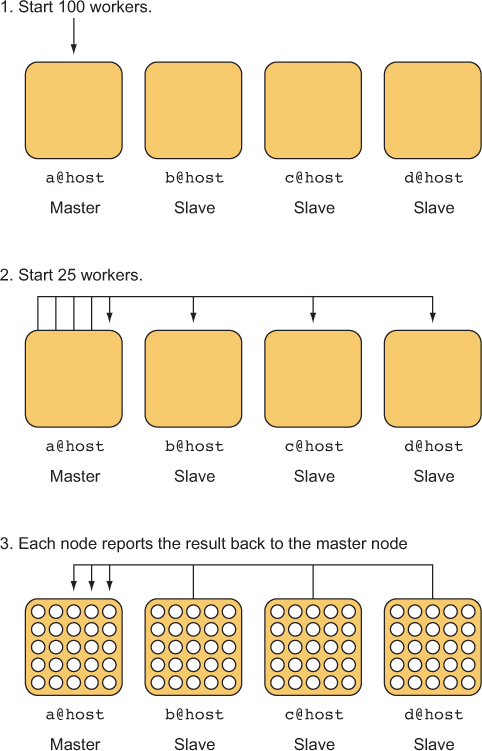
Elixir’s distribution model is based on the concept of nodes, where each node is an independent instance of the BEAM VM. Nodes communicate with each other using a lightweight protocol known as Distributed Erlang. Establishing a distributed Elixir system involves configuring nodes, defining communication strategies, and managing node discovery.
Node Configuration and Communication
Configuring nodes in Elixir requires specifying unique names and enabling distribution through a shared secret or cookie. Once configured, nodes can communicate seamlessly, allowing processes on different nodes to send messages and coordinate activities. Understanding the nuances of node configuration is crucial for building scalable distributed systems.
Node Discovery and Dynamic Clustering
In dynamic environments where nodes may join or leave the cluster dynamically, node discovery becomes a critical aspect of distributed systems. Elixir provides tools like :net_kernel and libraries like libcluster to facilitate dynamic node discovery and automatic clustering. We explore the implementation details and best practices for dynamic clustering in Elixir.
Distributed Systems in Elixir

Scaling a system beyond a single machine involves the implementation of distributed systems. Elixir, with its roots in Erlang—a language designed for building distributed and fault-tolerant systems—naturally excels in this arena. The distribution capabilities of Elixir enable the deployment of applications across multiple nodes, forming a distributed network.
Load Balancing Strategies

Effective load balancing is essential for distributing incoming requests across nodes, preventing bottlenecks and ensuring optimal resource utilization. Elixir applications can leverage load balancing techniques such as round-robin, consistent hashing, or custom algorithms. We delve into the implementation of these strategies and their impact on system performance.
Fault-Tolerant Clustering with OTP
Building fault-tolerant distributed systems goes hand-in-hand with clustering. OTP provides mechanisms for creating supervised and monitored clusters, where the failure of a node triggers automatic recovery and redistribution of workload. We explore how OTP supervisors can be utilized to achieve fault-tolerant clustering in Elixir.
Scalability Patterns and Strategies
As we navigate through the technical intricacies of scaling Elixir applications, we encounter various scalability patterns and strategies. Horizontal scaling, vertical scaling, and hybrid approaches each have their merits and challenges. Choosing the right strategy depends on factors such as application architecture, workload characteristics, and performance requirements.
Advanced Techniques for Scaling Elixir Applications
In the journey to scale Elixir applications, advanced techniques play a pivotal role in optimizing performance, enhancing fault-tolerance, and ensuring efficient resource utilization. In this continuation of our technical exploration, we delve into topics such as load testing, distributed tracing, and performance optimization.
Load Testing for Scalability Validation
Load testing is a critical phase in the scalability journey, allowing developers to simulate real-world scenarios and evaluate how the system behaves under different levels of stress. Tools like Tsung or Locust can be employed to generate realistic workloads and measure the system’s response. Let’s examine a basic example of load testing using Tsung:
Orchestrating Microservices with Elixir
Microservices architecture is a popular choice for building scalable and maintainable systems. Elixir, with its lightweight processes and OTP, is well-suited for orchestrating microservices. The following example illustrates a basic microservices architecture with Elixir:
This example demonstrates how individual microservices can be implemented as lightweight processes, and an orchestrator can coordinate their interactions. OTP’s supervision mechanisms further enhance the fault-tolerance of the microservices architecture.
Distributed Tracing for Performance Analysis
Distributed tracing provides insights into the flow of requests across distributed systems, helping identify bottlenecks and optimizing performance. Tools like OpenTelemetry can be integrated into Elixir applications to capture and trace requests. Let’s explore a basic example:
# Add OpenTelemetry to your mix.exs dependencies
defp deps do
[
{:opentelemetry, “~> 0.14”},
{:opentelemetry_trace, “~> 0.14”},
{:opentelemetry_metrics, “~> 0.14”}
]
end
# Configure OpenTelemetry in your application
config :opentelemetry,
service: “my_app”,
traces_reporter: {:console, :reporter}
# Instrument your code for tracing
OpenTelemetry.Tracer.start_link(__MODULE__)
span = OpenTelemetry.Tracer.start_span(“example_span”)
# Your code logic here
OpenTelemetry.Tracer.finish_span(span)
Performance Optimization Techniques
Optimizing the performance of an Elixir application involves profiling, identifying bottlenecks, and implementing targeted improvements. The following techniques demonstrate how to leverage Elixir tools for profiling and optimization:
Profiling with ‘ :etop ‘
# Start :etop for real-time performance monitoring
:etop.start()
Profiling with ‘ :fprof ‘
# Profile a function with :fprof
:prof.start()
MyModule.my_function(arg1, arg2)
:prof.stop()
Asynchronous Task Execution with ‘ Task.async/1 ‘
# Parallelize tasks with Task.async/1
tasks = Enum.map(data, fn item ->
Task.async(fn ->
process_item(item)
end)
end)
results = Enum.map(tasks, &Task.await/1)
Fine-Tuning Elixir Performance:
In the quest for optimal performance, Elixir developers often find themselves exploring advanced profiling and optimization strategies. In this comprehensive continuation of our technical exploration, we delve into more detailed profiling techniques, optimization strategies, and introduce additional tools to enhance your Elixir application’s efficiency.
Advanced Profiling with ‘ :fprof ‘
While :etop provides real-time insights, :fprof allows for more in-depth profiling of specific functions in your code. Here’s how to use :fprof:
# Start profiling
:prof.start()
# Code to be profiled
result = MyModule.my_function(arg1, arg2)
# Stop profiling
:prof.stop()
# View profiling results
:prof.display()
` MyModule.my_function ` will now be profiled, and you can analyze the results to identify which parts of your code consume the most resources.
Memory Profiling with ` :erts_debug.memory `
Understanding memory usage is crucial for optimizing performance. Elixir provides a memory profiler in the form of ` :erts_debug.memory ` . Let’s explore a basic example:
# Start memory profiling
:erts_debug.memory.start([])
# Code to be profiled
result = MyModule.memory_intensive_function(arg)
# Stop memory profiling
:erts_debug.memory.stop()
# View memory profiling results
:erts_debug.memory.display()
This will help you identify memory-intensive parts of your code and optimize accordingly.
Reducing Garbage Collection Pressure

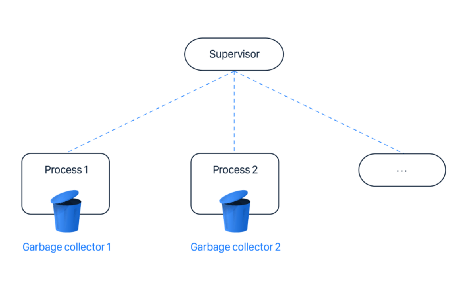
Elixir, running on the BEAM VM, employs a garbage collector for memory management. Minimizing garbage collection is key to improving performance. Strategies to reduce garbage collection pressure include:
Using Processes Wisely: Leverage lightweight processes for concurrency, but avoid creating too many short-lived processes.
Memory-Efficient Data Structures: Choose data structures carefully to minimize memory churn.
Profile and Optimize: Utilize :fprof and memory profilers to identify and optimize code causing excessive garbage collection.
Implementing Caching Strategies

Caching is a powerful technique to reduce redundant computations and enhance response times. Elixir applications can benefit from caching in various ways:
Memoization: Cache the results of expensive function calls to avoid recomputation.
Key-Value Stores: Utilize in-memory key-value stores like :ets or external caching systems like Redis for efficient data retrieval.
Erlang Term Storage (ETS): Leverage ETS tables for in-memory storage of frequently accessed data.
Integrating Load Balancers and Reverse Proxies
Scaling horizontally involves distributing the load across multiple nodes. Utilize load balancers and reverse proxies such as Nginx or HAProxy to evenly distribute incoming requests among your Elixir nodes. This helps prevent bottlenecks and ensures optimal resource utilization.
Continuous Performance Monitoring
Implementing continuous performance monitoring is crucial for detecting issues early on. Tools like Prometheus and Grafana can be integrated into your Elixir application to provide real-time insights into system metrics, enabling proactive optimization.
In this deep dive into profiling and optimization strategies, we’ve explored advanced techniques for understanding and enhancing the performance of your Elixir applications. From detailed function profiling with :fprof to memory profiling and strategies for reducing garbage collection pressure, these tools and techniques empower developers to fine-tune their code for optimal efficiency. Remember, performance optimization is an ongoing process, and each application has its unique characteristics. Regular profiling, strategic caching, and judicious use of resources are key to maintaining a performant Elixir application that can seamlessly scale to meet growing demands.
BACK


 USA
USA
 CANADA
 AUSTRALIA
 PAKISTAN